This step is for on-grid systems — grid-connected solar-only and hybrid designs. You capture daily use, usage profile, and tariffs in Energy Profile in Photonik Pro.
Off-grid? For off-grid sizing with a load table, use the off-grid load table tool.
Once the site is understood, open Energy Profile in Photonik Pro. The sections below follow the same order as the screen — work across the tabs as you work through this step.
How much do you use?
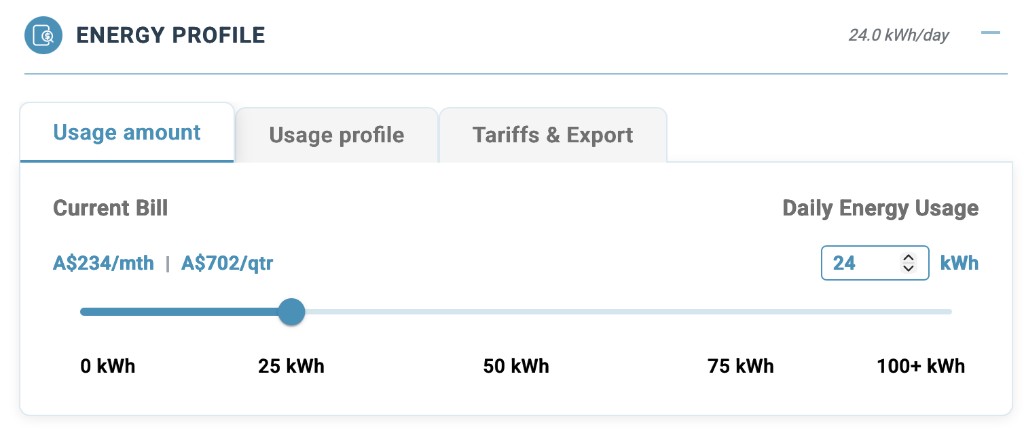
Everything downstream — system size, battery, savings — starts with your average daily use in kWh.
From your electricity bill
If you have bills, look for total kWh used over a month or a year and convert to a daily average:
- Annual bill — divide total kWh by 365.
- Monthly bill — divide that month’s kWh by the number of days in the bill period (or by 30 as a rough guide).
Use a full year if you can — one hot summer month or one cold winter month can mislead you.
If you do not have a bill
Estimate from household size and how hard you run heating, cooling, and appliances. A useful rule of thumb per person per day:
- Low (careful with energy) — about 2–3 kWh
- Medium (typical home) — about 4 kWh
- High (heavy heating, cooling, or always-on loads) — about 6 kWh or more
Multiply by the number of people. Homes in hot climates or large US properties often sit higher; compact homes in mild climates often sit lower. A four-person home at medium use is often roughly 15–25 kWh/day — but your bill beats any guess.
In Photonik Pro, open Energy Profile → Usage amount. Enter daily kWh with the slider or number field. Current Bill updates as a sanity check — use the bill maths above for the number you type in, not the estimate.
When do you use it?
Two homes can use the same kWh per day but need very different solar designs. Split this into a daily pattern and an annual pattern.
Daily pattern
How your use is spread through the day:
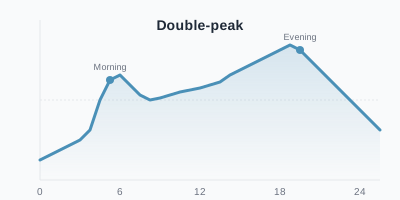
- Double-peak — busy morning and evening, quieter midday. Common in family homes.
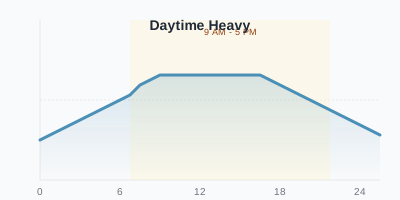
- Daytime heavy — more use while the sun is up. Good match for solar if you can run appliances during the day.
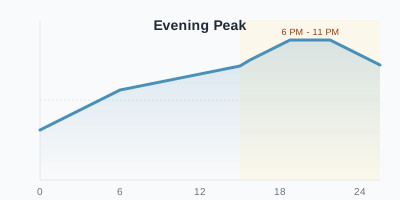
- Evening peak — most use after work. Solar alone won’t cover this without a battery or grid import.
- Flat — fairly steady day and night.
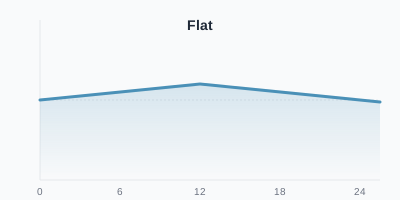
Annual pattern
How your use changes through the year:
- Flat — similar every month.
- Mid-year peak — higher in the middle months of the year. Common where your heaviest cooling load falls around mid-year.
- End-year peak — higher toward the start and end of the year. Common where heating or cooling peaks outside mid-year — which months that is depends on your climate.
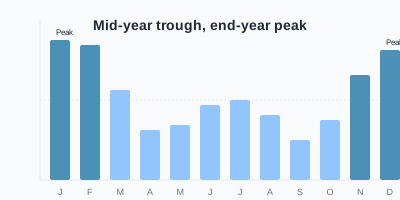
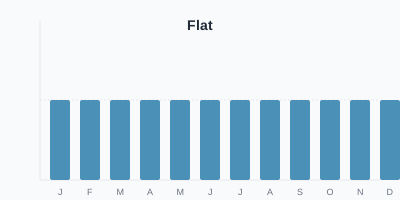
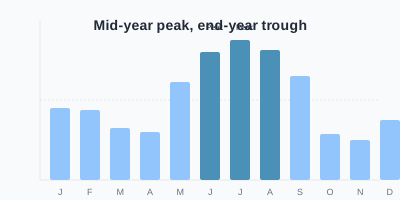
Pick the shapes that best match your home. Shifting loads to daylight — dishwasher, pool pump, EV charging — can improve solar savings without adding panels.
In Photonik Pro, open Energy Profile → Usage profile and pick the daily and annual cards that best match the shapes above. Savings and battery sizing in later steps update when you change profile.
What do you pay & earn?
Inputting the correct electricity tariffs for your property (both importing from the grid, and exporting solar to the grid) is useful for accurately modelling how much solar and batteries can save you.
- Usage rate — what you pay to buy electricity from the grid.
- Feed-in rate — what you are paid for solar you export.
- Daily supply charge — a fixed daily fee on top of per-kWh use.
Photonik models tariffs on a 24-hour daily basis. Currently this assumes a daily average, and does not have monthly or seasonal variation. The full 24-hour model can be seen and edited by clicking Edit tariff. We use a 24-hour model because tariffs are moving from simple peak and off-peak rates to more nuanced time-of-use rates that change throughout the day according to supply and demand. It is also increasingly common for consumers to access wholesale electricity rates, which change significantly throughout the day.
On the initial screen, you’ll see a simple average for usage (import) and feed-in (export), as well as a weighted average. The simple average is just that — the mean of the 24-hour rates — whereas the weighted average accounts for how much electricity is used at different times of the day, and gives greater weight to the higher-usage times.
In Photonik Pro, open Energy Profile → Tariffs & Export. Choose a tariff template close to the customer’s utility. The summary cards show usage and feed-in (average and weighted) plus daily supply charge. Set an export limit if the network requires it.
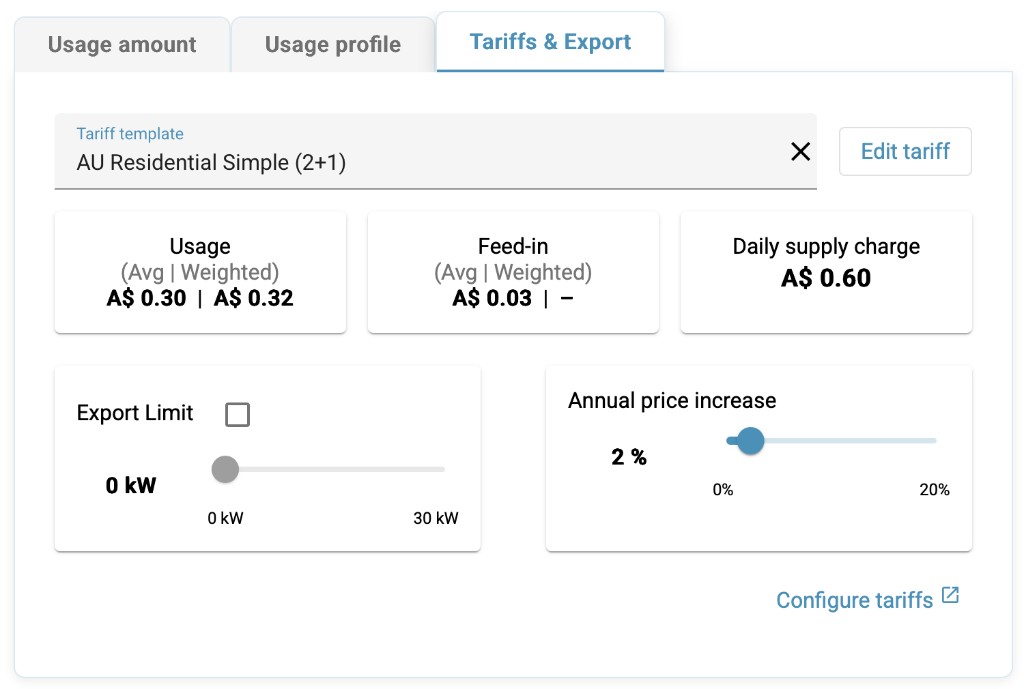
When time-of-use bands need tweaking, click Edit tariff:
- Select a time band — drag across hours on the grid, or use preset buttons (for example Peak 7–22 for usage, Solar 10–17 for feed-in).
- Set value — enter a price; it applies to every hour in the active band. Shift+drag extends the last band.
- Daily supply charge — set at the bottom of the editor.
- Save — choose Apply to this proposal only for a one-off customer rate; Save as new template if your business will reuse it. Business admins can Override current template on templates your company owns.
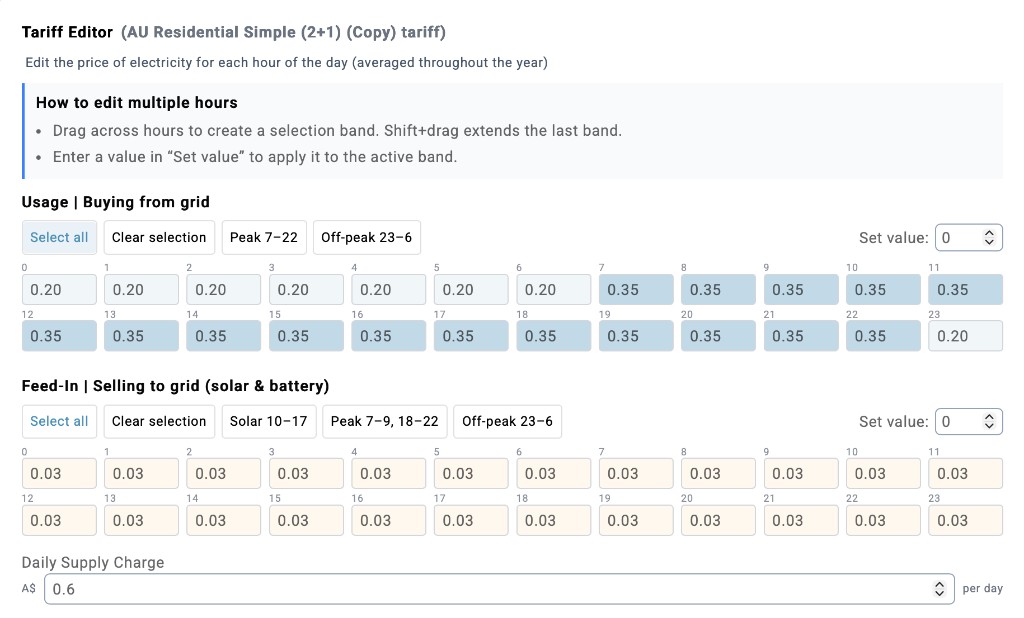
Reusable templates live in Settings — use Configure tariffs at the bottom of the tab to open your business tariff library.
Step 4 — System size turns this profile into a target kW.